Reactivity 3.1 Proton transfer reactions (HL)
Reactivity 3.1.9
Understandings:
Understandings:
- The pOH scale describes the [OH–] of a solution. pOH = –log10[OH–]; [OH–] = 10–pOH
- Interconvert [H+], [OH–], pH and pOH values.
- The equations for pOH are given in the data booklet.
|
Video coming soon.
|
Reactivity 3.1.10
Understandings:
Understandings:
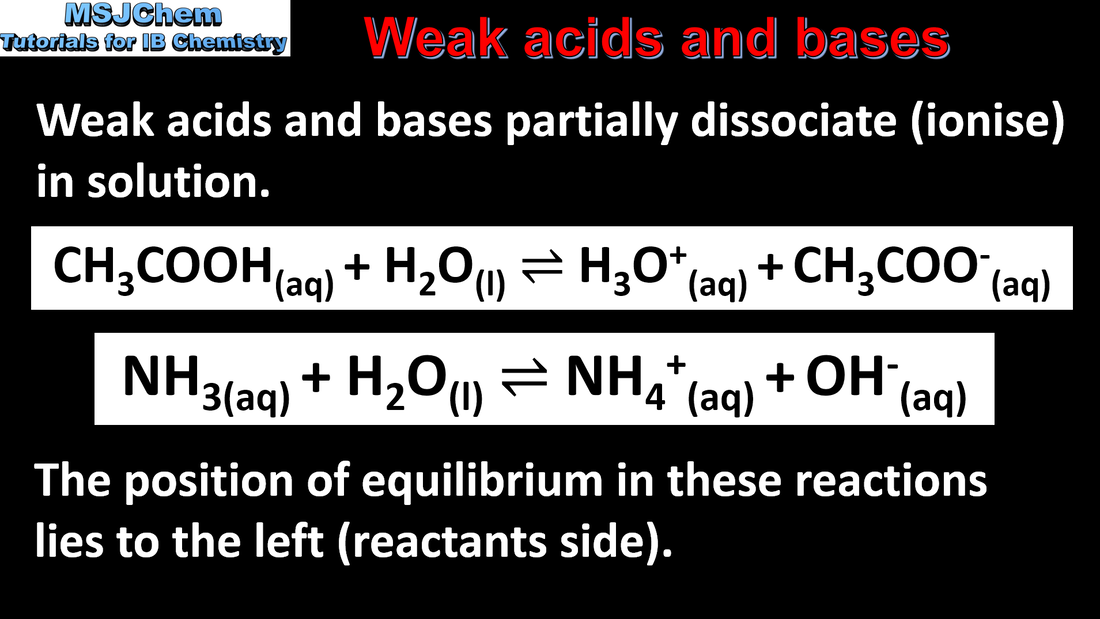
- The strengths of weak acids and bases are described by their Ka, Kb, pKa or pKb values.
- Interpret the relative strengths of acids and bases from these data.
|
This video covers Ka, Kb, pKa and pKb.
|
Reactivity 3.1.11
Understandings:
Understandings:
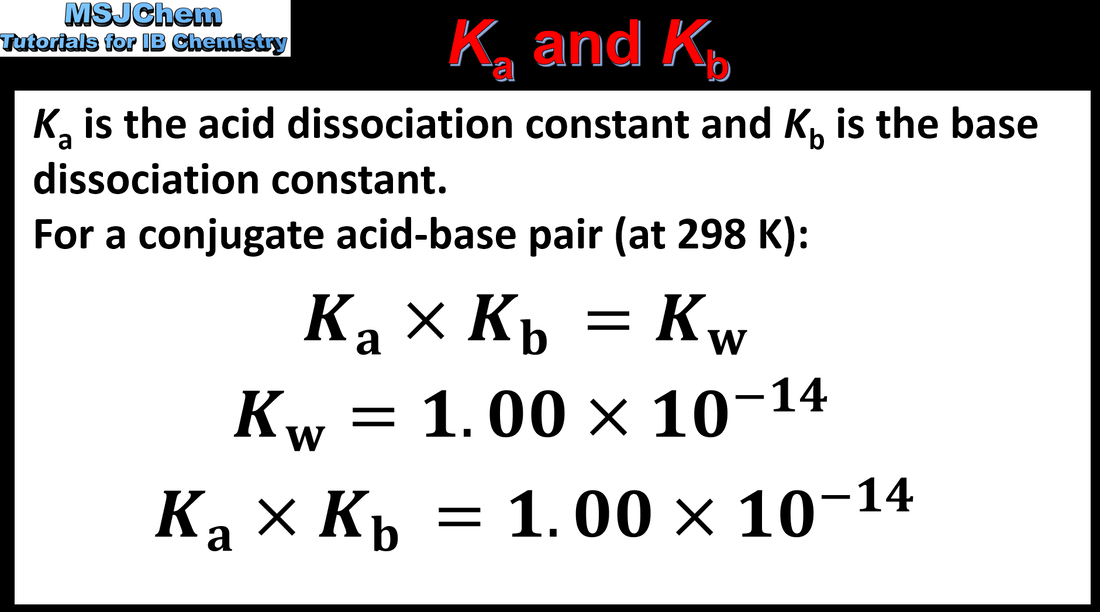
- For a conjugate acid–base pair, the relationship Ka × Kb = Kw can be derived from the expressions for Ka and Kb.
- Solve problems involving these values.
- The use of quadratic equations is not expected in calculations.
- Reactivity 2.3 How can we simplify calculations when equilibrium constants Ka and Kb are very small?
|
This video covers how to solve problems involving Ka, Kb and Kw.
|
Reactivity 3.1.12
Understandings:
Understandings:
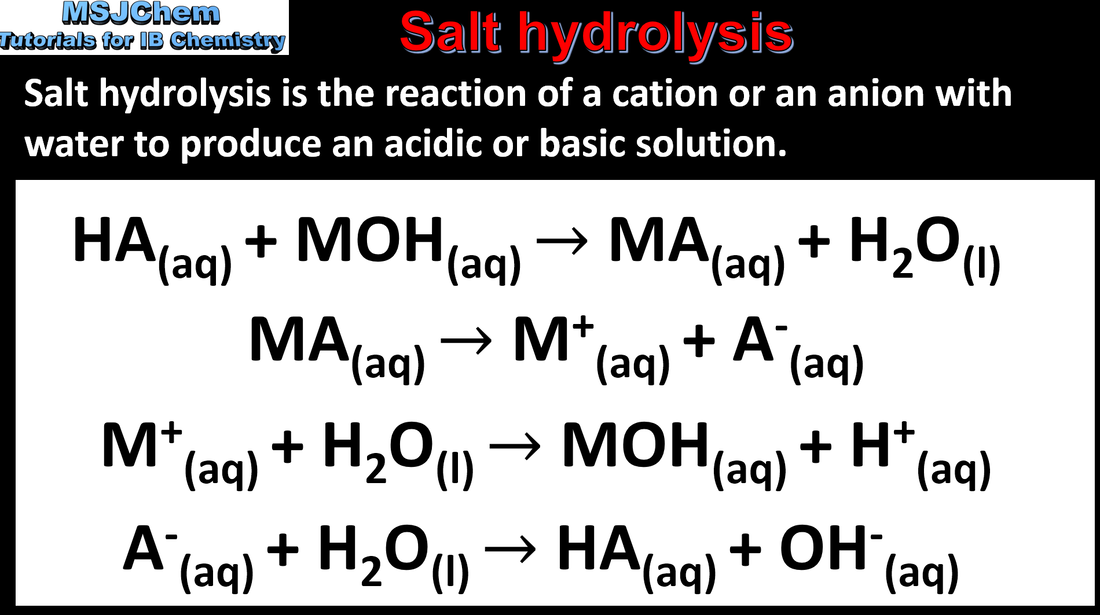
- The pH of a salt solution depends on the relative strengths of the parent acid and base.
- Construct equations for the hydrolysis of ions in a salt, and predict the effect of each ion on the pH of the salt solution.
- Examples should include the ammonium ion, the carboxylate ion, the carbonate ion and the hydrogencarbonate ion.
- The acidity of hydrated transition element ions and (aq) is not required.
|
This video covers salt hydrolysis.
|
Reactivity 3.1.13
Understandings:
Understandings:
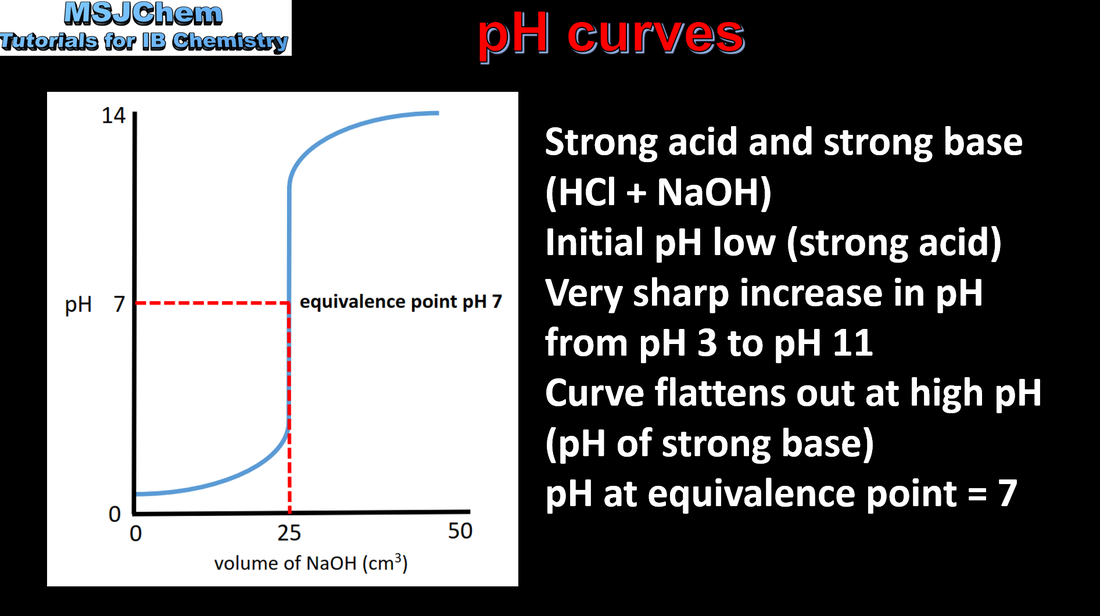
- pH curves of different combinations of strong and weak monoprotic acids and bases have characteristic shapes and features.
- Interpret the general shapes of pH curves for all four combinations of strong and weak acids and bases.
- Interpretation should include: intercept with the pH axis, equivalence point, buffer region, points where pH = pKa or pOH = pKb.
|
This video covers pH curves.
|
Reactivity 3.1.14 and 3.1.15
Understandings:
Understandings:
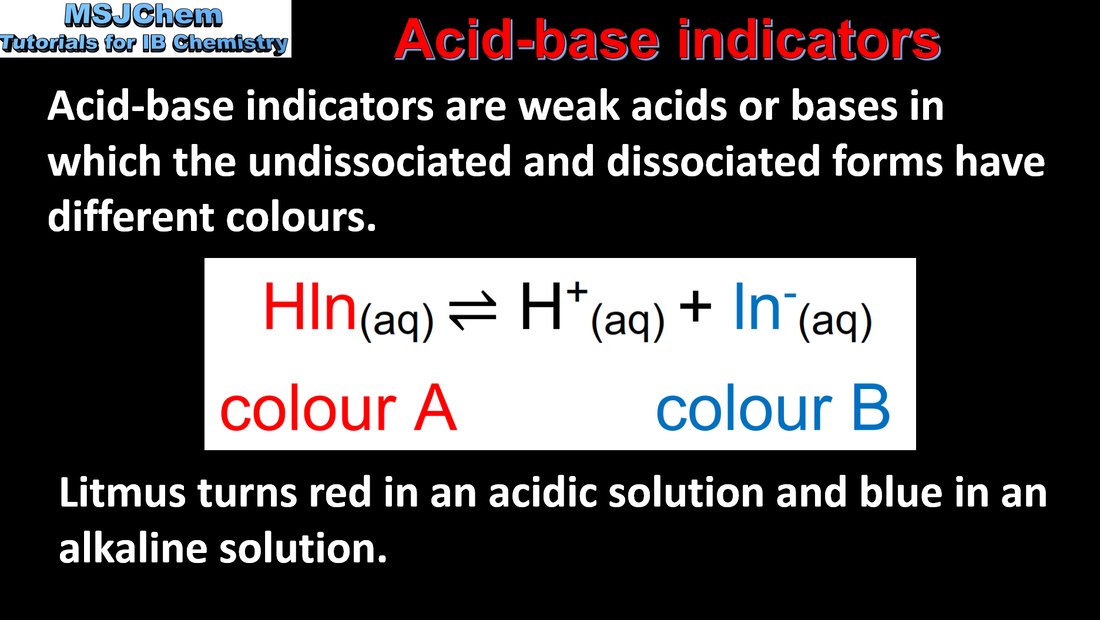
- Acid–base indicators are weak acids, where the components of the conjugate acid–base pair have different colours (3.1.14).
- The pH of the end point of an indicator, where it changes colour, approximately corresponds to its pKa value (3.1.14).
- An appropriate indicator for a titration has an end point range that coincides with the pH at the equivalence point (3.1.15).
- Construct equilibria expressions to show why the colour of an indicator changes with pH (3.1.14).
- Identify an appropriate indicator for a titration from the identity of the salt and the pH range of the indicator (3.1.15).
- The generalised formula HInd(aq) can be used to represent the undissociated form of an indicator.
- Examples of indicators with their pH range are given in the data booklet.
- Include universal indicator as a mixture of many indicators with a wide pH range of colour change.
- Distinguish between the terms “end point” and “equivalence point”.
|
This video covers acid-base indicators.
|
Reactivity 3.1.16
Understandings:
Understandings:
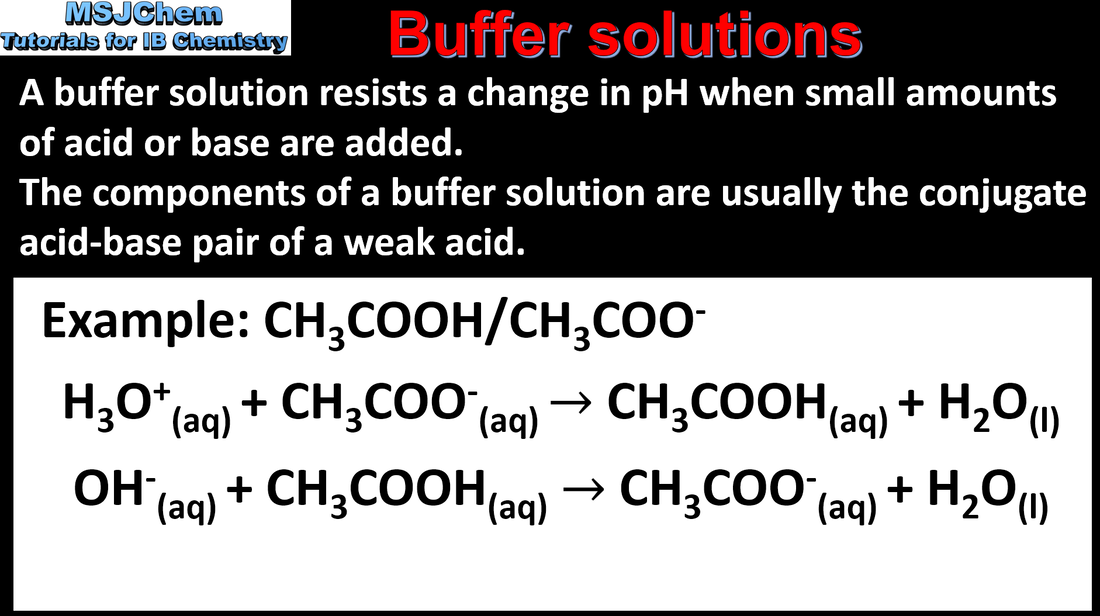
- A buffer solution is one that resists change in pH on the addition of small amounts of acid or alkali.
- Describe the composition of acidic and basic buffers and explain their actions.
- Reactivity 2.3 Why must buffer solutions be composed of weak acid or base conjugate systems, not of strong acids or bases?
|
This video covers buffer solutions.
|
Reactivity 3.1.17
Understandings:
the ratio of the concentration of acid or base to the concentration of the conjugate base or acid.
Learning outcomes:
Understandings:
- The pH of a buffer solution depends on both:
the ratio of the concentration of acid or base to the concentration of the conjugate base or acid.
Learning outcomes:
- Solve problems involving the composition and pH of a buffer solution, using the equilibrium constant.
- Include explanation of the effect of dilution of a buffer.
- Reactivity 2.3 How does Le Châtelier’s principle enable us to interpret the behaviour of indicators and buffer solutions?
|
Video coming soon.
|